


Page 80 - Demo
P. 80
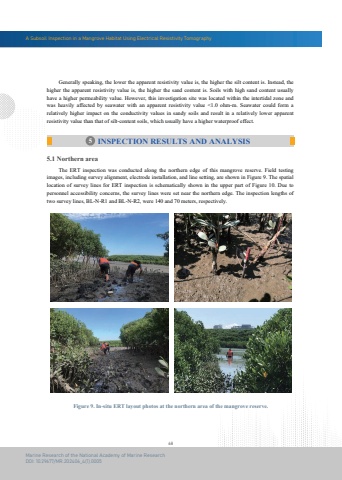
A Subsoil Inspection in a Mangrove Habitat Using Electrical Resistivity Tomography68Marine Research of the National Academy of Marine ResearchDOI: 10.29677/MR.202406_4(1).0005Figure 9. In-situ ERT layout photos at the northern area of the mangrove reserve. Generally speaking, the lower the apparent resistivity value is, the higher the silt content is. Instead, the higher the apparent resistivity value is, the higher the sand content is. Soils with high sand content usuallyhave a higher permeability value. However, this investigation site was located within the intertidal zone andwas heavily affected by seawater with an apparent resistivity value <1.0 ohm-m. Seawater could form a relatively higher impact on the conductivity values in sandy soils and result in a relatively lower apparent resistivity value than that of silt-content soils, which usually have a higher waterproof effect.5 INSPECTION RESULTS AND ANALYSIS The ERT inspection was conducted along the northern edge of this mangrove reserve. Field testing images, including survey alignment, electrode installation, and line setting, are shown in Figure 9. The spatial location of survey lines for ERT inspection is schematically shown in the upper part of Figure 10. Due to personnel accessibility concerns, the survey lines were set near the northern edge. The inspection lengths of two survey lines, BL-N-R1 and BL-N-R2, were 140 and 70 meters, respectively.5.1 Northern area


