


Page 75 - Demo
P. 75
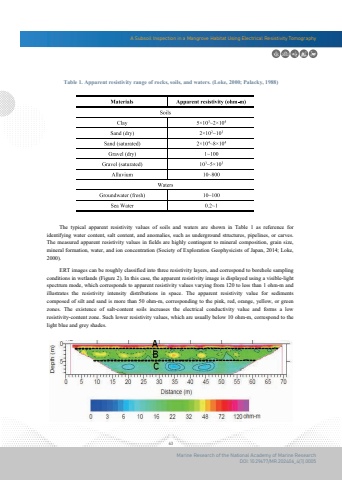
A Subsoil Inspection in a Mangrove Habitat Using Electrical Resistivity Tomography63Marine Research of the National Academy of Marine ResearchDOI: 10.29677/MR.202406_4(1).0005Table 1. Apparent resistivity range of rocks, soils, and waters. (Loke, 2000; Palacky, 1988) The typical apparent resistivity values of soils and waters are shown in Table 1 as reference for identifying water content, salt content, and anomalies, such as underground structures, pipelines, or carves. The measured apparent resistivity values in fields are highly contingent to mineral composition, grain size,mineral formation, water, and ion concentration (Society of Exploration Geophysicists of Japan, 2014; Loke, 2000). ERT images can be roughly classified into three resistivity layers, and correspond to borehole sampling conditions in wetlands (Figure 2). In this case, the apparent resistivity image is displayed using a visible-light spectrum mode, which corresponds to apparent resistivity values varying from 120 to less than 1 ohm-m and illustrates the resistivity intensity distributions in space. The apparent resistivity value for sediments composed of silt and sand is more than 50 ohm-m, corresponding to the pink, red, orange, yellow, or greenzones. The existence of salt-content soils increases the electrical conductivity value and forms a low resistivity-content zone. Such lower resistivity values, which are usually below 10 ohm-m, correspond to the light blue and grey shades.


