


Page 60 - Demo
P. 60
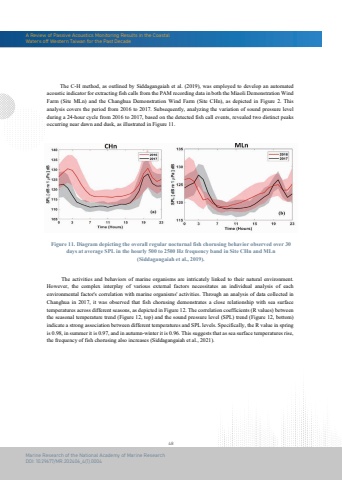
48Marine Research of the National Academy of Marine ResearchDOI: 10.29677/MR.202406_4(1).0004A Review of Passive Acoustics Monitoring Results in the CoastalWaters off Western Taiwan for the Past Decade The C-H method, as outlined by Siddagangaiah et al. (2019), was employed to develop an automated acoustic indicator for extracting fish calls from the PAM recording data in both the Miaoli Demonstration Wind Farm (Site MLn) and the Changhua Demonstration Wind Farm (Site CHn), as depicted in Figure 2. This analysis covers the period from 2016 to 2017. Subsequently, analyzing the variation of sound pressure level during a 24-hour cycle from 2016 to 2017, based on the detected fish call events, revealed two distinct peaks occurring near dawn and dusk, as illustrated in Figure 11. The activities and behaviors of marine organisms are intricately linked to their natural environment. However, the complex interplay of various external factors necessitates an individual analysis of each environmental factor's correlation with marine organisms' activities. Through an analysis of data collected in Changhua in 2017, it was observed that fish chorusing demonstrates a close relationship with sea surface temperatures across different seasons, as depicted in Figure 12. The correlation coefficients (R values) between the seasonal temperature trend (Figure 12, top) and the sound pressure level (SPL) trend (Figure 12, bottom) indicate a strong association between different temperatures and SPL levels. Specifically, the R value in spring is 0.98, in summer it is 0.97, and in autumn-winter it is 0.96. This suggests that as sea surface temperatures rise, the frequency of fish chorusing also increases (Siddagangaiah et al., 2021).Figure 11. Diagram depicting the overall regular nocturnal fish chorusing behavior observed over 30days at average SPL in the hourly 500 to 2500 Hz frequency band in Site CHn and MLn(Siddagangaiah et al., 2019).


