


Page 61 - Demo
P. 61
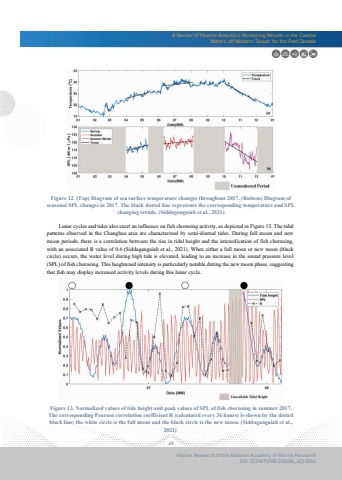
49A Review of Passive Acoustics Monitoring Results in the CoastalWaters off Western Taiwan for the Past DecadeMarine Research of the National Academy of Marine ResearchDOI: 10.29677/MR.202406_4(1).0004Figure 12. (Top) Diagram of sea surface temperature changes throughout 2017. (Bottom) Diagram ofseasonal SPL changes in 2017. The black dotted line represents the corresponding temperature and SPLchanging trends. (Siddagangaiah et al., 2021)Figure 13. Normalized values of tide height and peak values of SPL of fish chorusing in summer 2017.The corresponding Pearson correlation coefficient R (calculated every 36 hours) is shown by the dottedblack line; the white circle is the full moon and the black circle is the new moon. (Siddagangaiah et al.,2021) Lunar cycles and tides also exert an influence on fish chorusing activity, as depicted in Figure 13. The tidal patterns observed in the Changhua area are characterized by semi-diurnal tides. During full moon and new moon periods, there is a correlation between the rise in tidal height and the intensification of fish chorusing, with an associated R value of 0.6 (Siddagangaiah et al., 2021). When either a full moon or new moon (black circle) occurs, the water level during high tide is elevated, leading to an increase in the sound pressure level (SPL) of fish chorusing. This heightened intensity is particularly notable during the new moon phase, suggesting that fish may display increased activity levels during this lunar cycle.


