


Page 45 - Demo
P. 45
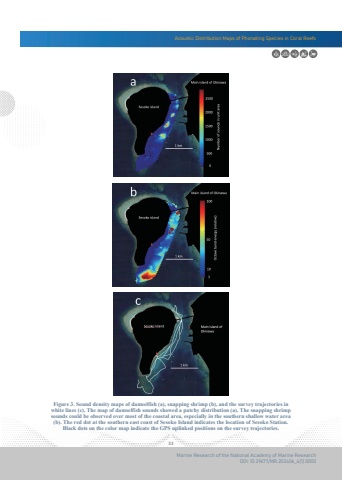
7Acoustic Distribution Maps of Phonating Species in Coral Reefs33Marine Research of the National Academy of Marine ResearchDOI: 10.29677/MR.202406_4(1).0003Figure 3. Sound density maps of damselfish (a), snapping shrimp (b), and the survey trajectories inwhite lines (c). The map of damselfish sounds showed a patchy distribution (a). The snapping shrimpsounds could be observed over most of the coastal area, especially in the southern shallow water area(b). The red dot at the southern east coast of Sesoko Island indicates the location of Sesoko Station.Black dots on the color map indicate the GPS uplinked positions on the survey trajectories.


