


Page 108 - Demo
P. 108
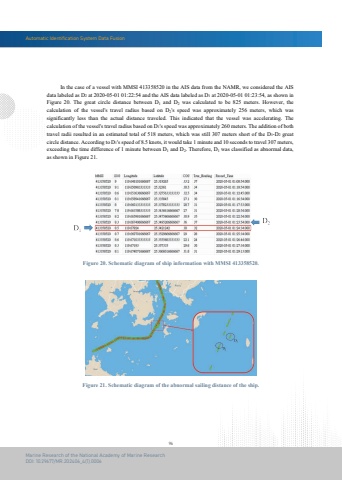
Automatic Identification System Data Fusion96Marine Research of the National Academy of Marine ResearchDOI: 10.29677/MR.202406_4(1).0006Figure 20. Schematic diagram of ship information with MMSI 413358520.Figure 21. Schematic diagram of the abnormal sailing distance of the ship. In the case of a vessel with MMSI 413358520 in the AIS data from the NAMR, we considered the AIS data labeled as D2 at 2020-05-01 01:22:54 and the AIS data labeled as D1 at 2020-05-01 01:23:54, as shown in Figure 20. The great circle distance between D1 and D2 was calculated to be 825 meters. However, thecalculation of the vessel's travel radius based on D2's speed was approximately 256 meters, which wassignificantly less than the actual distance traveled. This indicated that the vessel was accelerating. Thecalculation of the vessel's travel radius based on D1's speed was approximately 260 meters. The addition of both travel radii resulted in an estimated total of 518 meters, which was still 307 meters short of the D1-D2 great circle distance. According to D1's speed of 8.5 knots, it would take 1 minute and 10 seconds to travel 307 meters,exceeding the time difference of 1 minute between D1 and D2. Therefore, D1 was classified as abnormal data, as shown in Figure 21.


